Funktionen

Alles, was Wibbix tut, um Ihre Netzwerkknoten im Blick zu behalten.

Knoteneditor mit Gerätetyp-Symbolen, IP, Antennenhöhe und Prüfport

ICMP and TCP life checks

Wibbix checks each node with ICMP echo requests over raw sockets, aggregating several probes per check into an availability percentage and an average RTT.

For nodes where you set a check port, it uses a TCP connect instead — same aggregation, no elevated privileges required, so a TCP-only node is checked even where ICMP is unavailable.

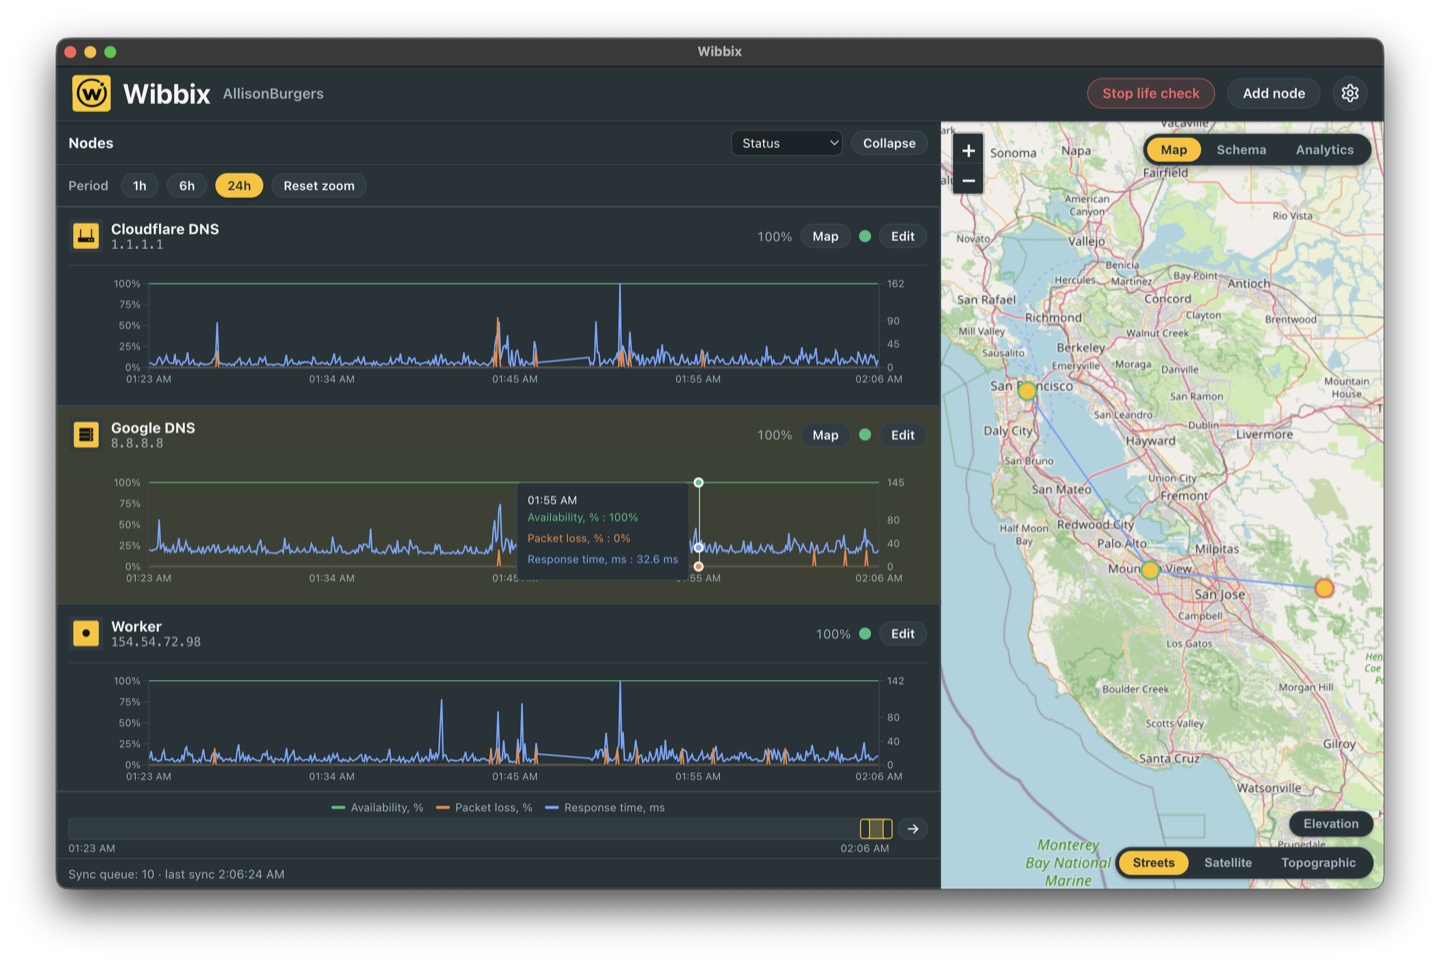
Die Wibbix-Karte mit Knotenmarkierungen und einem Ebenenumschalter

Interactive map

See your nodes on a Leaflet map with three base layers: OSM streets, Esri satellite (with a city-names and boundaries overlay) and topographic. A status ring around each marker shows up, down, stale or unknown at a glance.

You can draw links between nodes manually from the map's right-click menu.

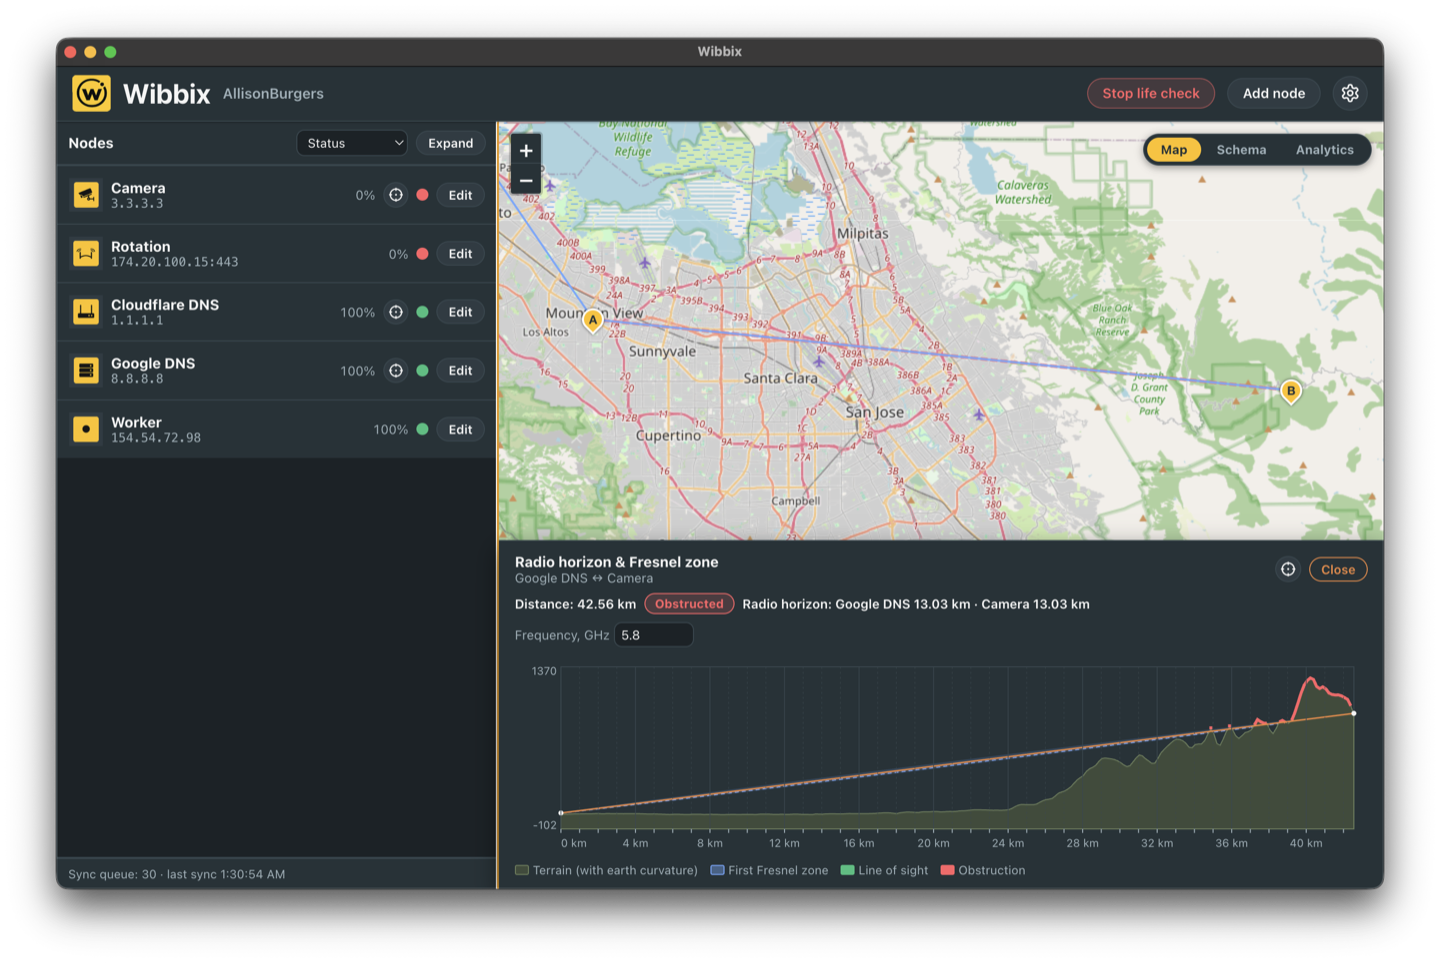
Geländeprofil mit Funkhorizont und Fresnel-Zone zwischen zwei Knoten

Radio horizon and Fresnel zone

For any pair of nodes Wibbix computes the radio horizon and Fresnel zone over real terrain (SRTM/Copernicus elevation), accounting for each node's configurable antenna height.

A terrain-profile panel under the map shows the path with the endpoints as draggable A/B pins, and colors the path green when the link is clear or red when it is obstructed.

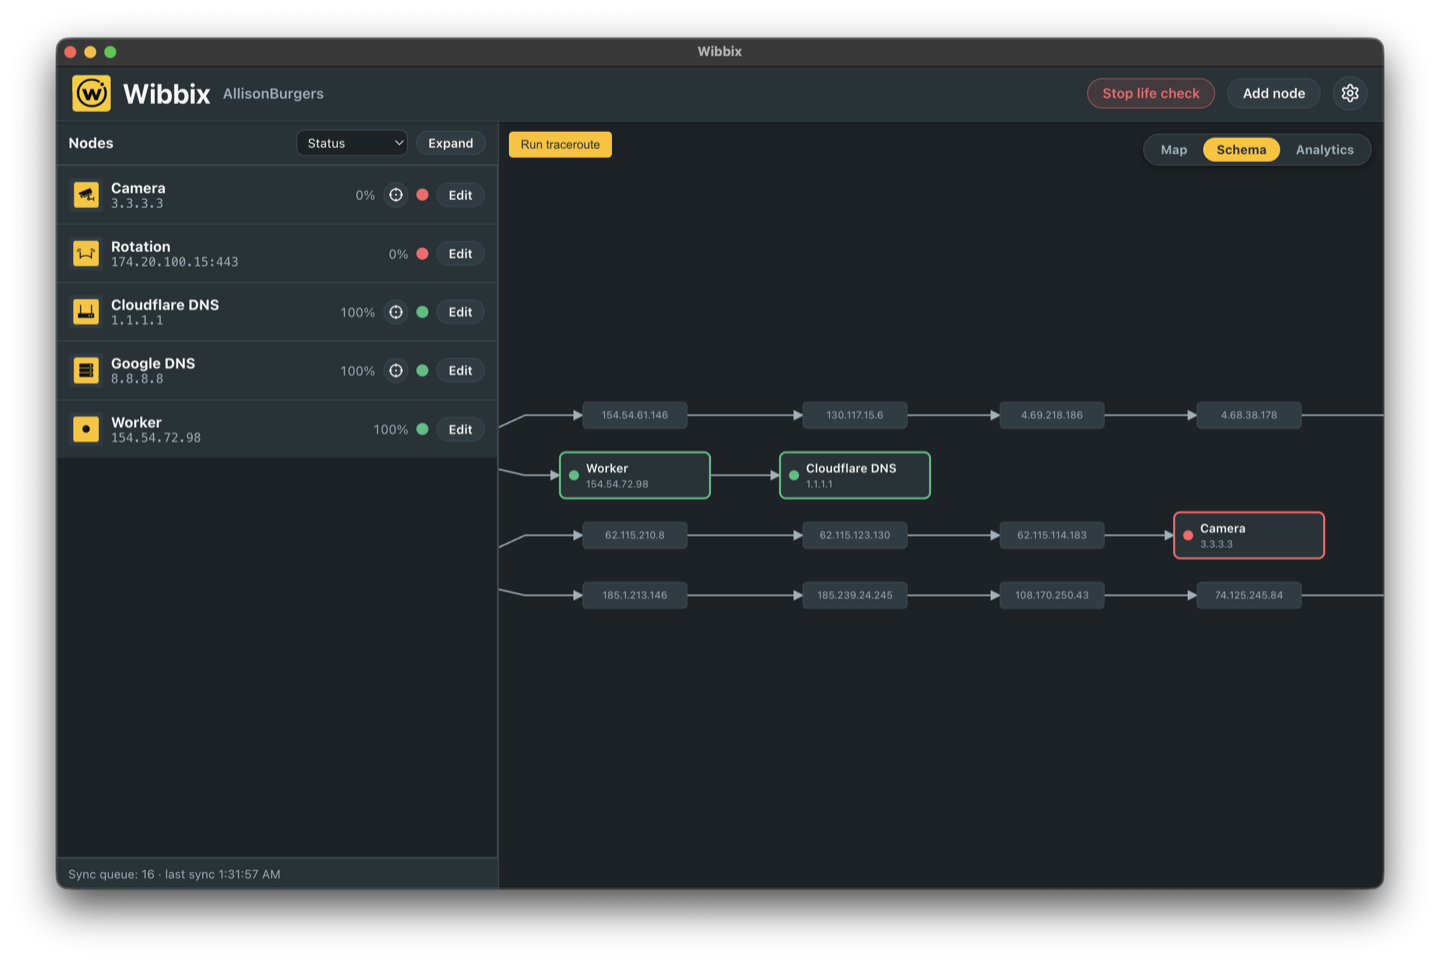
Automatisch erstelltes Netzwerkschema aus der Traceroute-Topologie

Network schema

As an alternative to the map, a classic network diagram is built automatically from traceroute data collected by the desktop app, showing nodes and the discovered links between them.

Analyseübersicht der Flotte mit Verfügbarkeitskarten und Trenddiagrammen

Fleet analytics

An analytics view summarizes all your nodes over a selectable period: a fleet uptime overview (up/down/stale/unknown counts, average uptime and total downtime), a best/worst per-node uptime ranking, a per-device-type availability breakdown and a fleet trend chart (availability, RTT and packet loss).

Telegram bot

Link a Telegram chat with a one-time code from the desktop app and get notified when a node goes down (flap-damped, after several consecutive failed checks) and when it recovers.

The bot also answers interactive commands, in all five interface languages.

In-app auto-update

The desktop app checks for new versions on startup and periodically, and updates itself, so you stay on the latest build without manual downloads.

Full internationalization

Both the website and the desktop app are fully translated into English, Russian, French, Spanish and German, and light and dark themes are available everywhere.

Admin tooling

Administrators get a device-log viewer, a user list with online/offline presence, and remote diagnostics — queuing allow-listed, non-destructive commands (log upload, snapshots, ping, traceroute) for a user's desktop app.